Data Visualization
Using D3
Kevin Bluer
Agenda
- Tonight's Goal...
- What is D3?
- What's Possible :)
- Development Concepts
- Next Steps
Background
- NYC Based Software Developer
- 10+ Years
- MEAN (Mongo, Express, Angular, Node), HTML5, CSS3, JS
- Instructor at the General Assembly
Tonight's Goal

From this...
Tonight's Goal

to this :)
Tonight's Goal
- Have a basic, and deeper understanding of D3
- Where you should use it (and where you shouldn't)
- See the potential for "enhanced" story telling
- Be inspired to explore D3 further
What is D3 and why should you use it?

Overview
- "...a magical chunk of JavaScript code that helps you express data visually on the web..."
- Data Driven Documents (D3)
- Library for creating data visualizations *
- * Although this somewhat undersells it
- Renders in a browser...uses HTML, CSS, JavaScript, SVG
Origins
- Announced in 2011
- Successor to Protovis (although it had an abstract representation layer, didn't operate against the DOM)
- Created and maintained by Mike Bostock (supported by Vadim Ogievetsky and Jeff Heer)
Where is it used?
- SumAll
- Github
- New York Times (which is where the author works)
- Square
- Recorded Future
- Simple
- Boundary
What it does...
- Specifically...
- Loads the data into the browsers memory
- Binds data to elements within the document (DOM)
- Transforms elements by interpreting the bound datum and setting visual properties accordingly
- Transitions elements between states in response to user input
- Unlike Protovis and equivalent...
- + Simpler debugging
- + Easier experimentation / prototyping
- + Greater visual possibilities
- - Slightly steeper learning curve
What it doesn't do...
- Provide out of the box visualizations, charts, etc
- Support older browsers (which keeps the codebase clean and free of hacks)
- Work with bitmaps, primarily vector (SVG) based
- Hide your original data (given it's all executed client side…if you're data can't be shared, don't use D3)
Explanatory versus Exploratory Tools
- Exploratory
- Discover insights, meaning, patterns in data
- Examples include Tableau, ggplot2 for R
- Explanatory
- More constrained and limited, but also very focused
- D3 excels at this (and less ideal for the former)
Alternatives
- Highcharts
- Raphael
- JavaScript InfoVis Toolkit
- Google Charts API
- Flot
- However...
What's possible?
lots of examples...

Examples
- Storytelling with Data
- Data Analysis
- Geomapping
- Fun and Unusal
- Libraries, Tools & Extensibility
Trend Towards Digital Storytelling
- Also referred to as "Data-driven Journalism"
- As well as web applications, also presentations, slides, etc...anywhere you want to tell a story
ST / Wealth of Nations

ST / Infographics

ST / Fashion Week

ST / Facebook IPO

DA / Github #1

DA / Github #2

DA / Github #3

DA / Candlestick Charts

DA / Square Crossfilter

JavaScript library for exploring large multivariate datasets in the browser. D3 for all the visualization.
Geomapping
- Based around geoJSON
- Geographic data structure
- Leverages paths to create polygons, etc
- Libraries of Shapefiles out there
- Used to build "choropleth" maps
- A thematic map in which areas are shaded or patterned in proportion to the measurement of the statistical variable being displayed on the map
Choropleth Map

Alternative for coloring arbitrary ranges.
Pan and Zoom

Includes markers on cities.
Storytelling Via Maps

Directed Graph Editor
Example of interactivity
Repulsion

Uses HTML5 Canvas (as opposed to SVG)
Tools, Libraries, & Extensibility
- Playground
- Increasing number of libraries that build on top of D3
- NVD3
- Cubism (Square)
- Rickshaw (Shutterstock)
- D3 also plays nicely with other libraries and frameworks
- Backbone and CoffeeScript
- Three.js
D3 Playground

NVD3
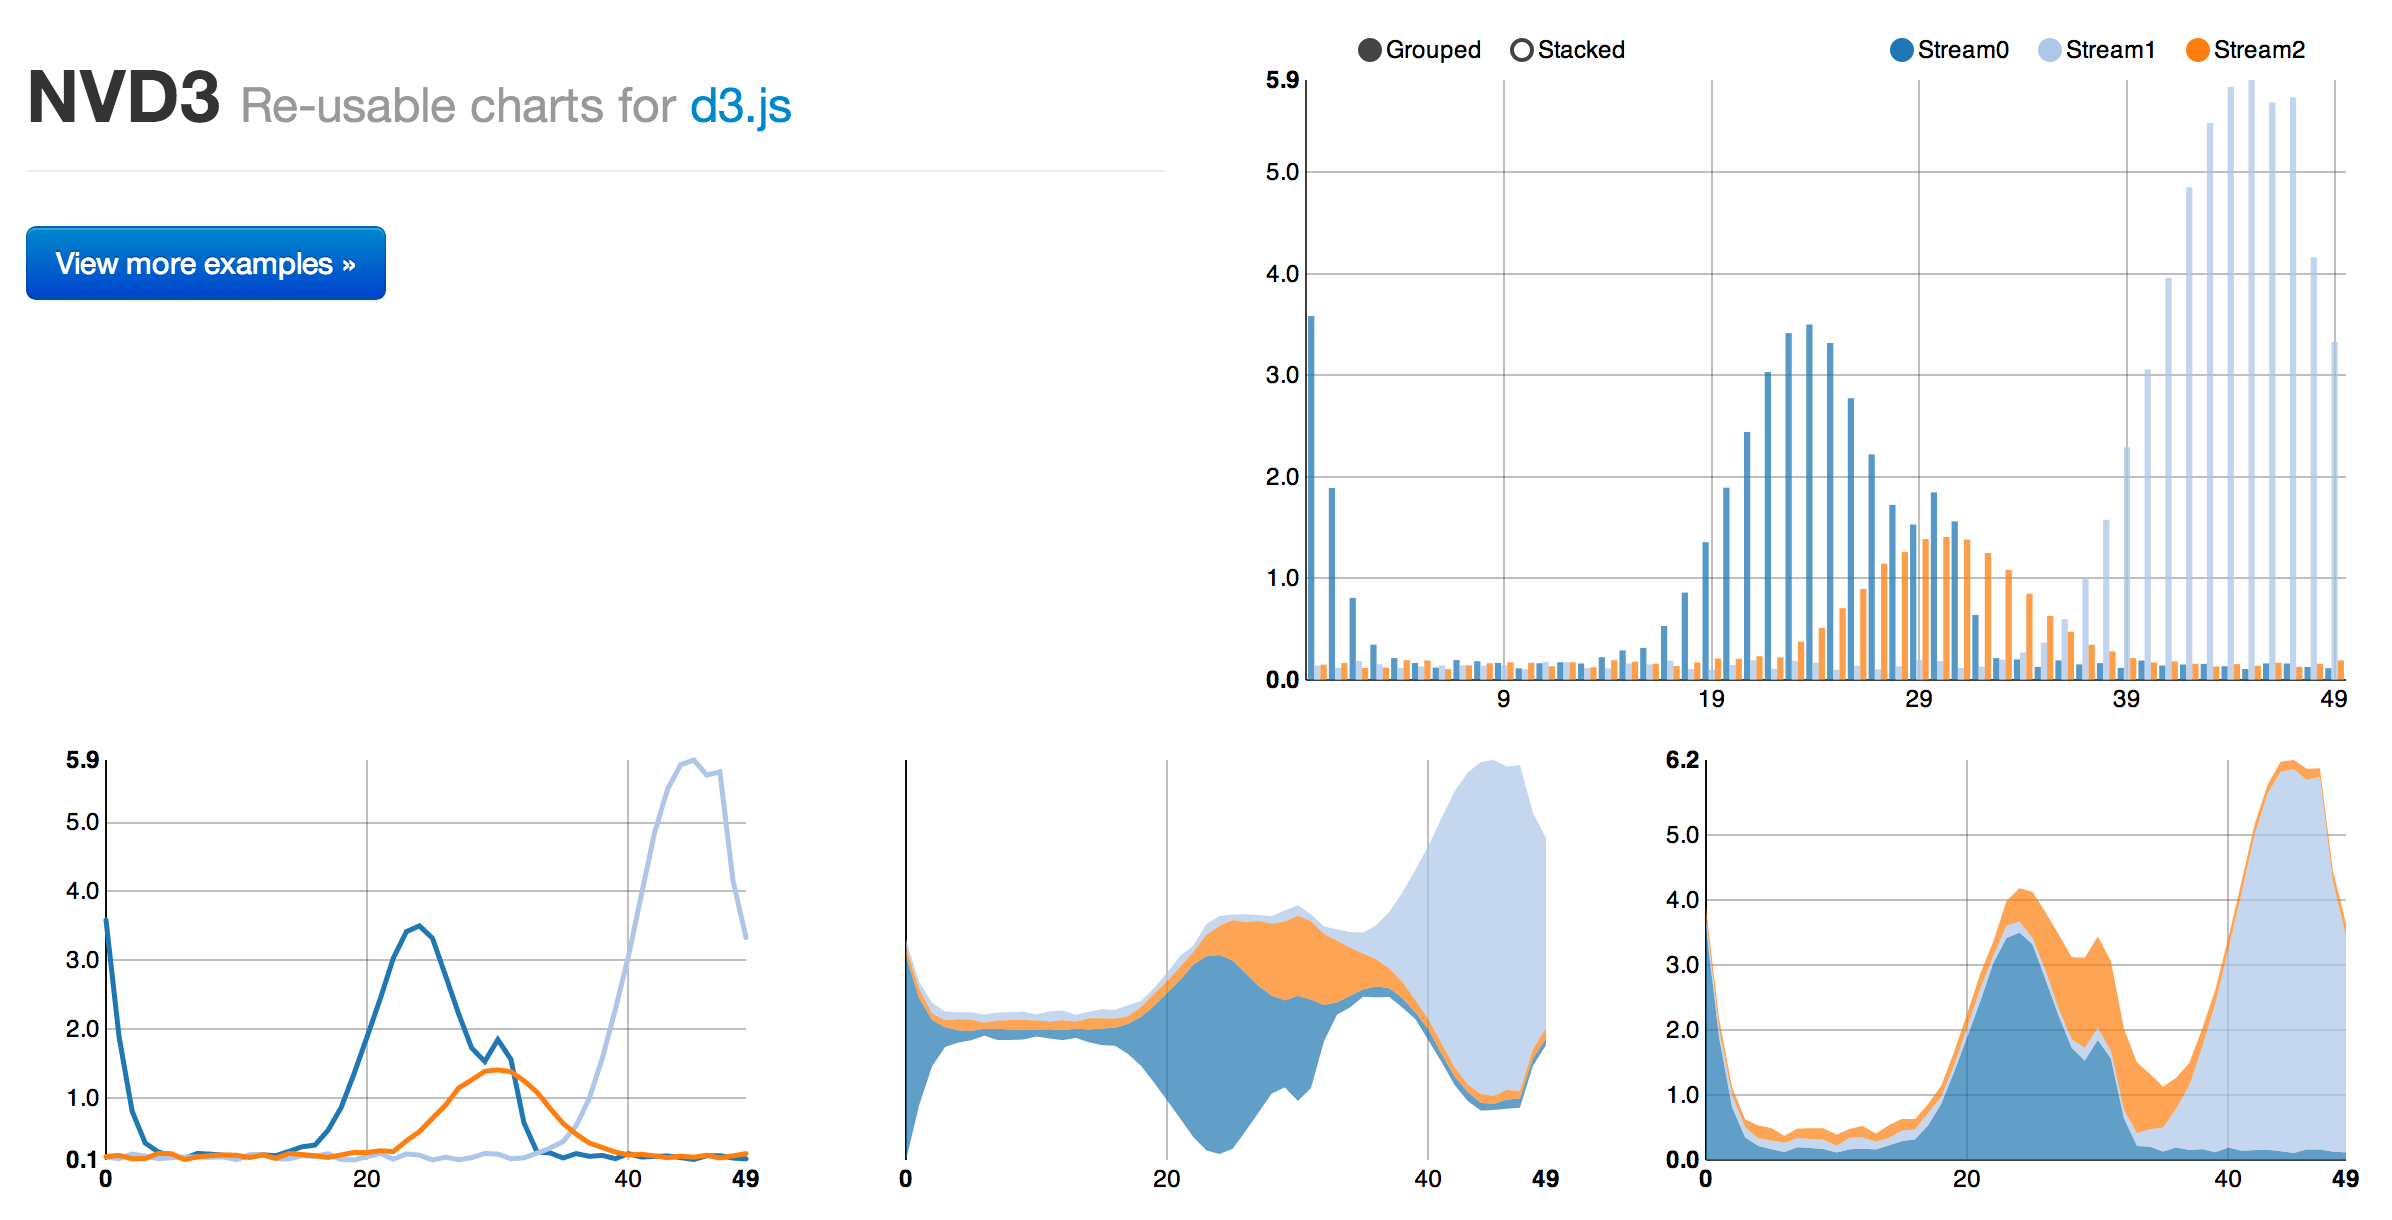
More NVD3

Simple Bar Chart

Taken from the D3 playground...
The data
// Array of objects (each containing a title and an array of values)
// This of course could be loaded remotely and in a variety of formats

[
  {title:"Good Stock",values:[10,20,30,40,50]},
  {title:"Bad Stock",values:[40,20,1,35,12]},
  {title:"Bostock",values:[1,1,2,3,5,8,13,21,34,55,89]}
]
The CSS
#playground { text-align:center }
article { display:inline-block; margin:1em 2em; position:relative }
article h2 {
	margin:0; padding:0;
	position:absolute; width:100%; top:100%;
	font-size:100%
}
.bar {
	display: inline-block;
	width: 15px;
	background: #369; color:white;
	border:3px outset #69c;
	border-bottom:1px solid #000;
	border-radius:2px 2px 0 0;
}
The JavaScript #1
/* 1. select the element to which we want to attach the visualization */
/* 2. and bind the data (note that selectAll will create the elements) */
var a = d3.select('#playground').selectAll('article').data($data);

/* 3. enter() will create the elements returned from the selectAll */
/* because they didn't yet exist it will create them */
a.enter().append('article').append('h2').text(function('title'));

/* notice the chaining syntax that is used */
selectAll()→data()→enter()→append()
The JavaScript #2
/* 1. same principal as above, this time for the bars in the graph */
/* 2. the data being bound is the values in the array */

var bars = a.selectAll('div.bar').data(function('values'));
bars.enter().append('div').attr('class','bar');

/* 3. adjust the height of the bars as appropriate */
bars.style('height',pxScale(2));

/* 4. the func used to scale the bars by a factor of 2 */
function pxScale(factor){
  return function(d){ return d*factor+'px' }
}
Next Steps
THANK YOU :)
And please reach out at [email protected] ...